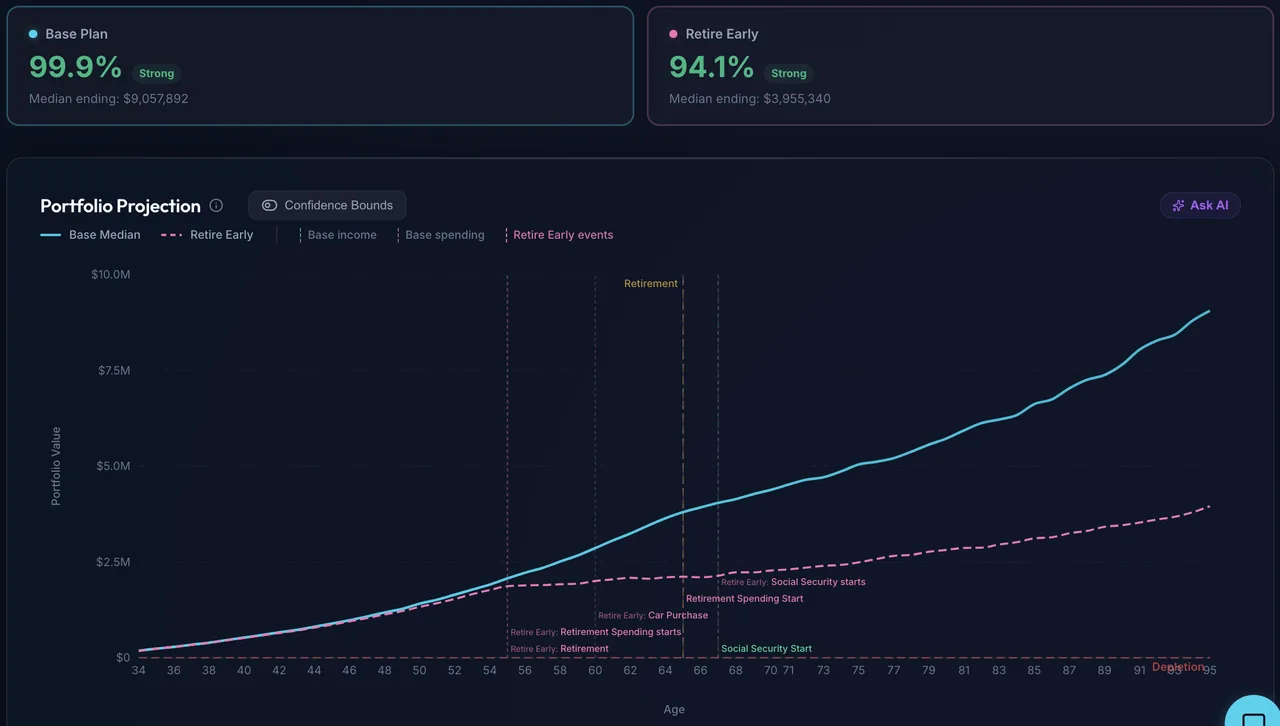
What Monte Carlo Success Rate Should You Actually Target for Early Retirement?
The 95% success rate you've been chasing was built for a 30-year retirement, not a 50-year one. Real simulation data on how horizon, withdrawal rate, and asset allocation actually move the number, and why allocation is the cheaper lever.
Short answer: most early retirees should target 80% to 90%, not the 95% or higher figure they have absorbed from conventional retirement advice. That standard was calibrated for a 30-year retirement, and it does not transfer to a 40 or 50-year one. If you review your plan annually and can flex discretionary spending after a bad market, 80% to 85% is defensible. If you plan to set it and forget it, aim for 90% or above. The rest of this article shows the math behind those numbers.
Run any retirement calculator and it hands you a single number: 82%, 94%, 100%. Most people treat it like a test score. Below 90 feels like you failed something. This is the wrong way to read a Monte Carlo result, and for anyone planning a 40 or 50-year early retirement instead of a standard 30-year one, it's an expensive mistake. It pushes people to work extra years chasing a few extra percentage points of certainty they never actually needed.
Let's get into the actual math, then translate it into a number you can use.
What "success rate" is actually measuring
A Monte Carlo retirement simulator doesn't predict the future. It takes historical market data and reshuffles it into hundreds or thousands of alternate versions of history your retirement could have landed in, then checks how many of those versions leave you with money at the end.
Our own engine, the one behind the free calculator at the bottom of this article, does this by running 1,000 independent trials sampled from 98 years of real U.S. market returns (1928 to 2025), using block bootstrap sampling in 5-year chunks so it preserves real crashes, real recoveries, and the real relationship between stock and bond returns, rather than treating every year as an independent coin flip. Everything is calculated in inflation-adjusted terms, so a "success" means your spending power held up, not just the nominal dollar figure.
The "success rate" is simply: of those 1,000 alternate histories, what percentage never ran your portfolio to zero. That's it. It's not a probability assigned by a statistician who has looked at your specific life. It's a description of how your specific withdrawal rate, asset allocation, and time horizon would have fared across a wide sample of the market conditions we've actually lived through.
This number is only as meaningful as the assumptions feeding it, and one of those assumptions, time horizon, matters enormously more than most people realize.
What "withdrawal rate" actually means
A 4% withdrawal rate does not mean "withdraw 4% of whatever the portfolio is worth each year." It means: in year one you withdraw 4% of your starting portfolio, and every year after that you withdraw that same amount adjusted upward for inflation. On a $1.5M portfolio that's $60,000 in year one. If inflation runs 3%, you take $61,800 the next year, then $63,654, and so on, regardless of what the market did in between.
That distinction is the whole ballgame. A plan that withdraws a fixed percentage of the current balance can never technically run out of money, since 4% of a shrinking number is always something, but it hands you an income that collapses exactly when markets do. A plan that withdraws a fixed real dollar amount gives you a stable, predictable lifestyle, and that stability is precisely what creates failure risk: you keep pulling $60,000 of purchasing power out of a portfolio that just fell 35%, which means selling more shares at the worst possible moment.
Every number in this article is stated in today's dollars, because the simulator holds your withdrawal constant in real terms and samples inflation-adjusted historical returns. So the success rates below measure how often a stable, inflation-protected lifestyle survived, not how often some floating percentage survived. Keep this in mind for the guardrails strategies later on, which sit deliberately between those two extremes.
Why 95% was calibrated for a 30-year retirement
The success rate targets most people have absorbed (90%, 95%, "why not just aim for 100%") trace back to research built around a 30-year retirement: retire at 65, plan to age 95. William Bengen's original 1994 paper and the Trinity Study that followed both used that window, and a 4% withdrawal rate landed around 95% success in that context (Pfau, Retirement Researcher).
A FIRE retirement is a different shape entirely. Retire at 35 or 40 and you're underwriting a 50 to 60-year spend-down, not 30. More years means more exposure to the handful of historically bad sequences that wreck a portfolio, and more years of inflation compounding against a fixed real withdrawal. We ran this directly through our simulation engine, holding everything constant except the number of years, at a 4.0% withdrawal rate on a $1.5M portfolio, 70/30 stock-to-bond allocation:
| Retirement horizon | Withdrawal rate | Success rate |
|---|---|---|
| 30 years | 4.0% | 94.4% |
| 40 years | 4.0% | 85.0% |
| 50 years | 4.0% | 80.8% |
This shows the same withdrawal rate, same portfolio, same allocation. The only thing that changed is how many years the money has to last, and that alone knocked 13.6 points off the success rate. If you retire early and plug your numbers into a calculator expecting a 30-year retirement's worth of comfort, the honest FIRE number is going to look scarier than you were braced for.
Lever one: withdrawal rate, and why the curve bends
Withdrawal rate is the variable most people reach for first. Holding the 50-year horizon and the 70/30 allocation fixed, and moving only the withdrawal rate:
| Withdrawal rate | Annual spend on $1.5M | Success rate |
|---|---|---|
| 4.00% | $60,000 | 80.8% |
| 3.50% | $52,500 | 88.8% |
| 3.25% | $48,750 | 92.4% |
| 3.00% | $45,000 | 95.2% |
| 2.75% | $41,250 | 97.0% |

Notice the shape of that curve. Dropping from 4.0% to 3.5%, a 12.5% cut in annual spending, buys you 8 points of success rate. Dropping from 3.25% to 2.75%, a comparable-sized cut, buys you only 4.6 points. Each additional slice of safety costs more than the last one and returns less. This is the mathematical version of the argument Dr. Jim Dahle makes at White Coat Investor: chasing a 99% or 100% success rate usually means saving well past the point of diminishing returns, working extra years to buy certainty against outcomes that were already unlikely (White Coat Investor).
It's also worth noticing what doesn't happen as horizon stretches from extreme to more extreme. Push the same 70/30 portfolio out to 60 years and a 3.25% withdrawal rate still clears 90.9%, only about two points below its 50-year result. Sequence of returns risk is heavily front-loaded: the years that determine whether your portfolio survives are mostly the first 10 to 15 years of retirement. A portfolio that makes it through that window intact tends to keep compounding well past it, which is why the marginal danger of retiring at 35 instead of 45 is smaller than most people assume.
Lever two: asset allocation, where the bigger swing actually lives
Withdrawal rate gets the attention, but it is not the input with the largest effect on these numbers, and it happens to be the more expensive one to pull. Here is the same $1.5M portfolio at an unchanged 4.0% withdrawal rate, moving only the stock-to-bond mix across all three horizons:
| Stocks / Bonds | 30 years | 40 years | 50 years |
|---|---|---|---|
| 0 / 100 | 48.3% | 22.2% | 12.5% |
| 20 / 80 | 76.2% | 49.9% | 35.7% |
| 40 / 60 | 91.3% | 75.2% | 63.6% |
| 60 / 40 | 94.9% | 84.0% | 77.9% |
| 70 / 30 | 94.4% | 85.0% | 80.8% |
| 80 / 20 | 93.6% | 84.4% | 81.9% |
| 90 / 10 | 92.1% | 84.9% | 82.2% |
| 100 / 0 | 90.3% | 84.0% | 81.2% |

Three things are worth pulling out of that grid.
The catastrophic end is the conservative end, not the aggressive end. A 50-year retirement funded entirely by bonds succeeded 12.5% of the time. That is not a subtle statistical artifact, it is arithmetic. Real bond returns in this dataset averaged roughly 1.8% a year, and you cannot withdraw 4% a year in real terms from an asset yielding 1.8% real for half a century. The money runs out; the only question is which decade. Counter-intuitively, the portfolio that feels safest is the one that fails almost every time.
The best allocation shifts toward stocks as the horizon lengthens. At 30 years the peak sits around 60% stocks. At 40 years it moves to roughly 70%. At 50 years it drifts up near 90%. The familiar advice to de-risk into bonds as you age was calibrated for someone spending down over 30 years. Run the same logic over 50 and it partially inverts, because a longer horizon gives equities more time to recover from the drawdowns that make them feel dangerous while giving inflation more time to grind down the bond side.
Past roughly 60% stocks it is a plateau, not a slope. At 50 years, every allocation from 60/40 through 100/0 lands between 77.9% and 82.2%. That is a spread of about 4 points across an enormous range of portfolios. So this is not a case for going all-in on equities. It is a case that once you are above roughly 60% stocks you have captured nearly all the benefit on offer, and the rest of the decision is about what volatility you can actually live through without capitulating at the bottom.
Which lever is bigger
Put the two side by side over a 50-year horizon and the asymmetry is hard to miss:
- Moving allocation from 20/80 to 90/10, withdrawal rate unchanged at 4%: 35.7% to 82.2%. A gain of 46.5 points, and your spending stays at $60,000.
- Moving withdrawal rate from 4.0% to 2.75%, allocation unchanged at 70/30: 80.8% to 97.0%. A gain of 16.2 points, and your spending falls by $18,750, close to a third of your income.
Withdrawal rate is a lever you pay for in lifestyle. Allocation is a lever you pay for in volatility tolerance. When an early retiree sees an uncomfortable success rate, the reflex is to plan on spending less or working another two years. Checking whether the portfolio is simply too conservative for the horizon is the cheaper move, and it is the one people skip. This is Dahle's "too conservative" argument showing up in the allocation column rather than the savings column.
A "failure" almost never means you actually run out of money
The other correction worth making is about what a sub-100% result actually implies. Michael Kitces and Derek Tharp have made the case that "probability of success" is the wrong label entirely, and that it should really be read as a "probability of adjustment." Their research modeled a retiree couple and found that if you're willing to revisit your plan periodically and trim spending when markets underperform, the gap between targeting 95% success and targeting 50% success barely shows up in your median outcome. The main thing that changes is how much you're allowed to spend on day one (Kitces.com).
That reframing matters most if you're the kind of person who checks in on your plan every year or two, which describes most FIRE households already. A 15% chance of "failure" in a static model usually just means: at some point, in some simulated world, you'd have needed to spend a bit less than planned. It rarely means destitution, especially if your floor expenses (housing, food, insurance) are smaller than your total withdrawal and could absorb a cut without changing your life.
Guardrails: targeting a lower number on purpose
If adjusting spending in response to markets is the real safety valve, some retirees build that adjustment into the plan up front instead of leaving it implicit. This is the idea behind the Guyton-Klinger guardrails approach: start at a lower initial success rate target (WCI's example uses 80%), but pair it with a rule that cuts spending if your ongoing probability of success falls to 25%, and a rule that raises spending if it climbs back to 100%. Because the plan is designed to flex both directions, you can safely start from a lower, less conservative number than a static plan would ever tolerate.
Morningstar's research team (Blanchett, Finke, and Pfau) found that this kind of dynamic, guardrails-based withdrawal strategy supported a 5.2% starting withdrawal rate in their modeling, well above the roughly 3.9% starting rate their research recommends for a fixed, never-adjusted withdrawal plan (Morningstar). WCI walks through a real client example built on this framework: a couple able to move from $172,000 to $220,000 in after-tax annual spending by adopting guardrails instead of a fixed real-dollar withdrawal, while their probability of success actually improved, from 69% under the old approach to 99% under the new one, because the plan could correct itself instead of running on autopilot for three decades (White Coat Investor).
So what number should you actually target?
There isn't a single correct answer, but here's a defensible framework:
If you're building a plan you intend to set and mostly forget, without regular check-ins or the willingness to trim spending, lean toward 90% or higher, and build in a real cash or bond buffer for the early years specifically, since that's where sequence risk is concentrated.
If you plan to revisit your numbers annually and can flex discretionary spending when markets are unkind (which is most people who got into FIRE by tracking their finances closely in the first place), an 80 to 85% initial target is defensible, provided your non-negotiable expenses sit comfortably below your planned withdrawal.
Weight time horizon more than the success rate itself. A 50-year retirement at 3.25% and an 85% success rate is a materially different, and generally better-built, plan than a 30-year retirement at 4% and a 94% success rate, even though the second number looks more comforting on its face.
Fix the allocation before you cut the spending. If your success rate comes back lower than you want, check where you sit on the stock-to-bond grid before you start trimming your life. Anything below about 50% equities over a multi-decade horizon is very likely costing you more success rate than a spending cut would buy back, and it costs nothing to correct.
None of this accounts for taxes or investment fees, and none of it is personalized financial advice. It's a description of how the math behaves so you can read your own results with more context than a single percentage gives you.
Run your own numbers
The fastest way to see how your specific horizon, withdrawal rate, and allocation interact is to run them, not estimate them. Our free Monte Carlo retirement simulator runs the same 1,000-trial, block-bootstrap engine used for the examples above against your actual numbers, with support for Social Security, custom glide paths, and side-by-side what-if comparisons. No account required, nothing saved unless you choose to share the link.
Try the free Monte Carlo retirement calculator →
Sources
- White Coat Investor, "Risk-Based Guardrail Retirement Withdrawal Strategy"
- White Coat Investor, "Reasons Your Retirement Plan Is Too Conservative"
- Kitces.com, Derek Tharp, "A Monte Carlo 50% Retirement Success Probability Can Work"
- Morningstar, "The Best Strategies for Boosting Starting Withdrawal Rates in Retirement"
- Wade Pfau, Retirement Researcher, "Safe Withdrawal Rates for Retirement and the Trinity Study"
Frequently asked questions
What Monte Carlo success rate should you target for early retirement?
Most early retirees should target 80% to 90%, not the 95% or higher figure commonly cited. If you plan to review your numbers annually and can trim discretionary spending after a bad market, an 80% to 85% initial target is defensible. If you intend to set the plan and forget it, aim for 90% or above. The widely quoted 95% target comes from research built around a 30-year retirement, so it does not transfer cleanly to a 40 or 50-year FIRE horizon.
Is a 90% Monte Carlo success rate good enough to retire?
For most plans, yes. A 90% success rate does not mean a 10% chance of destitution. It means that in 10% of simulated market histories you would have needed to adjust spending at some point. Researchers including Michael Kitces argue the metric is better read as a probability of adjustment than a probability of failure, because retirees who revisit their plan can correct course long before a portfolio actually depletes.
Why is my FIRE success rate lower than the 4% rule suggests?
Because the 4% rule was calibrated for a 30-year retirement. Holding everything else constant, a 4% withdrawal rate on a 70/30 portfolio simulated at 94.4% success over 30 years, 85.0% over 40 years, and 80.8% over 50 years. The extra decades add more exposure to bad return sequences and more inflation compounding against a fixed real withdrawal, so an early retiree should expect a lower number from the same inputs.
What withdrawal rate is safe for a 50-year retirement?
In our simulations on a 70/30 portfolio over 50 years, a 3.25% withdrawal rate reached 92.4% success and 3.0% reached 95.2%, compared with 80.8% at 4.0%. Rates between 3.0% and 3.5% are a reasonable planning range for a 50-year horizon, though the figure moves substantially with asset allocation and with whether you are willing to adjust spending as you go.
Does asset allocation matter more than withdrawal rate for early retirement?
Over long horizons it often matters more, and it is cheaper to change. Over 50 years at a fixed 4% withdrawal rate, moving from 20% stocks to 90% stocks raised the success rate from 35.7% to 82.2%, a gain of 46.5 points with no change in spending. Cutting the withdrawal rate from 4.0% to 2.75% at a fixed 70/30 allocation gained only 16.2 points and cost nearly a third of annual income. Check whether your portfolio is too conservative for the horizon before planning to spend less.
What is the biggest risk to an early retirement portfolio?
Sequence of returns risk, concentrated in the first 10 to 15 years. Poor returns early in retirement force you to sell more shares to fund the same real withdrawal, which permanently reduces the base that later compounding works on. This front-loading is why extending a horizon from 50 to 60 years changes the success rate only slightly, while the first decade of returns changes it dramatically.